
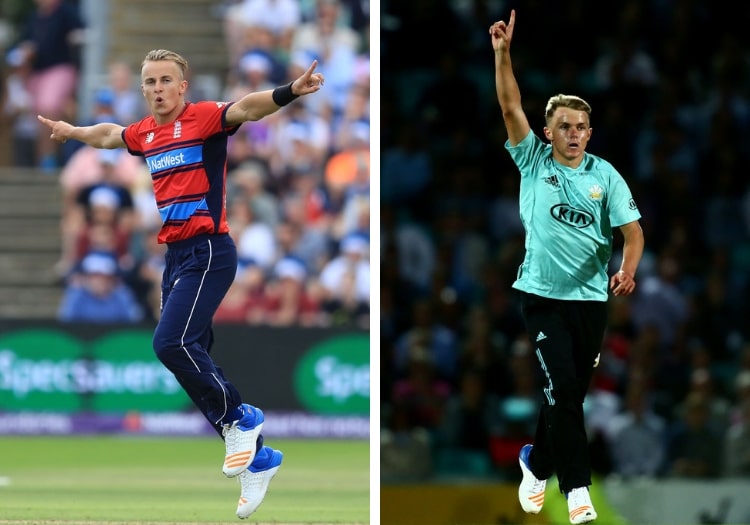
Tom Curran has been putting in some great performances for the Sydney Sixers in the Big Bash, while his young brother Sam was made the most expensive overseas player at the 2019 IPL auction, but how do they stack up against each other in the Index?
The first release of the FICA-endorsed T20 Player Index of 2019 saw Tom Curran break into the top 100 of the standings for the first time since it started, while it also saw his younger brother Sam drop almost two hundred places to number 444.
Sam, however, became the most expensive overseas player at the 2019 IPL auction after the King’s XI Punjab gave him a contract worth £800,000. Tom will not be taking part having been released by the Kolkata Knight Riders.
Does this fairly reflect their ability and impact they have had? Their respective positions in the Index would seem to suggest not.
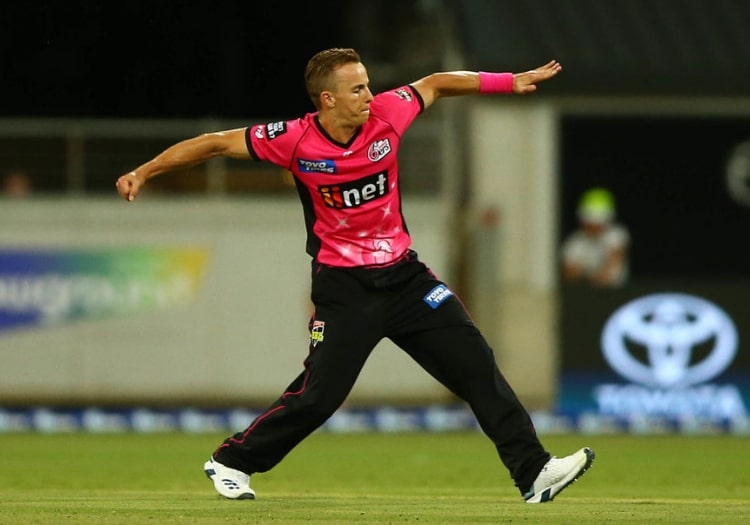
Tom Curran has broken into the top 100 for the first time since the Index started
The elder of the Currans is helped by the fact that he has been playing in the Big Bash while Sam has not. However, Tom has been doing more than just playing, he has been succeeding in a way he has not previously.
Tom is now at number 93 having taken 11 wickets for the Sydney Sixers while maintaining an economy rate of 6.92, which is far lower than the 8.56 he has recorded over the past three years.
Not just that, he has shown himself to be a proper allrounder, scoring a third of the runs he had over the past three years already in this tournament. He has done this at a strike rate of 144.15 as well, much higher than the 129.9 he normally goes at.

Sam Curran was the most expensive overseas player at the 2019 IPL auction
Sam’s time at the IPL will be the first time he has ever played in T20 tournament other than for Surrey in England’s Vitality Blast, while Tom has played in three different domestic T20 tournaments.
As the T20 Player Index takes into numerous factors of this kind, and weights those factors accordingly, this explains why though they have similar figures (as seen below) they are so far apart.
| Standing | Matches | Win % | Runs | Strike Rate | Boundary % | Wickets | Economy | Dot Ball % | |
| T Curran | 93 | 48 | 52.1 | 408 | 129.9 | 15.3 | 54 | 8.56 | 35.5 |
| S Curran | 444 | 40 | 52.5 | 442 | 122.8 | 14.7 | 35 | 8.26 | 40.3 |
Sam should rise up the Index quickly when he makes his IPL debut, but whether he is worth the money that the King’s XI spent on him remains to be seen.

Welcome to www.thecricketer.com - the online home of the world’s oldest cricket magazine. Breaking news, interviews, opinion and cricket goodness from every corner of our beautiful sport, from village green to national arena.