
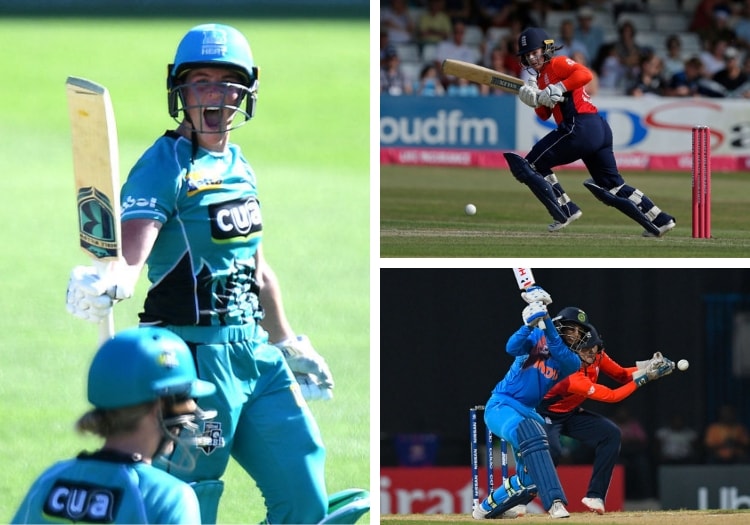
JOHN LEATHER explores how the women's T20 landscape has shifted over the past decade after 2018 featured a third of all centuries ever scored in the format...

On May 5, 2010, Deandra Dottin became the first woman to score a T20 hundred, when she blazed 112 not out for West Indies vs South Africa at Warner Park, St Kitts. In almost nine years since that innings, there have been a further 57 women’s T20 centuries.
Nine centuries and eight different centurions in 2017 both set new records for women’s T20 cricket in a calendar year, which were both promptly shattered by an astonishing 19 hundreds from 16 different players in 2018.
A third of all the women’s T20 centuries ever made have been scored in the last 12 months.
| Year | WBBL/KSL | T20I | Other | Total | No. of centurions |
| 2010 | 0 | 2 | 1 | 3 | 3 |
| 2011 | 0 | 0 | 3 | 3 | 3 |
| 2012 | 0 | 0 | 6 | 6 | 5 |
| 2013 | 0 | 0 | 7 | 7 | 7 |
| 2014 | 0 | 1 | 2 | 3 | 3 |
| 2015 | 1 | 0 | 3 | 4 | 4 |
| 2016 | 1 | 0 | 3 | 4 | 3 |
| 2017 | 4 | 3 | 2 | 9 | 8 |
| 2018 | 8 | 4 | 7 | 19 | 16 |
Before October 2017, a total of three centuries had been made in women’s T20Is, with none for three years. In the space of just over a month, that figure was doubled, and another four were added in 2018.
In matches played between the established top 10 T20I sides between 2009 and 2016, the women’s T20I run rate for a calendar year never exceeded 6.05 and the average first-innings total was never higher than 125.
Since the start of 2017 run rates have exploded, with 6.72 rpo and an average winning first-innings total of 156.45 in 2018 both records for a calendar year in which more than 10 matches were played. Eight of the 10 highest women's T20I totals were made in 2018.
Closer examination of T20I batting stats reveals that, while strike rate didn’t move much between 2009 and 2015, the way in which runs were being scored began to alter from 2014 onward, with boundary-hitting becoming more significant.
| Year | Matches | Run rate | Highest score | Ave 1st innings |
| 2009 | 29 | 5.87 | 165 | 118.46 |
| 2010 | 39 | 6.01 | 180 | 122.67 |
| 2011 | 27 | 6.00 | 166 | 118.12 |
| 2012 | 62 | 5.47 | 166 | 110.83 |
| 2013 | 37 | 5.71 | 152 | 113.41 |
| 2014 | 71 | 5.85 | 191 | 119.99 |
| 2015 | 30 | 5.70 | 188 | 114.43 |
| 2016 | 56 | 6.05 | 187 | 124.43 |
| 2017 | 13 | 6.47 | 181 | 137.85 |
| 2018 | 81 | 6.72 | 250 | 134.54 |
These changes coincided with the first steps toward professionalism in women’s cricket.
Australia were given improved contracts after the 2013 ODI World Cup, with England quickly following suit. The years since have been marked by improved remuneration across all 10 established nations, with Ireland the most recent to announce professional national contracts in December.
The first professional domestic women's T20 league, the WBBL, began in 2015-16, followed by England's KSL in 2016.
Both have featured increasing boundary rates (particularly sixes), strike rates, and winning totals with each season, and both saw vast spikes for all those metrics during 2018.
| Tournament | Matches | Strike rate | Balls per boundary (4 or 6) | Balls per 6 |
| WBBL01 | 59 | 97.61 | 9.8 | 121.6 |
| KSL 2016 | 17 | 102.14 | 7.5 | 84.1 |
| WBBL02 | 57 | 101.22 | 8.7 | 80.1 |
| KSL 2017 | 17 | 102.26 | 7.3 | 47.0 |
| WBBL03 | 59 | 104.88 | 8.2 | 65.4 |
| KSL 2018 | 32 | 116.75 | 6.2 | 44.6 |
| WBBL04* | 38 | 117.86 | 6.8 | 46.0 |
Lastly, after the 2017 ODI World Cup, the ICC made a notable change to the international playing conditions, whbringing them in line with those which had been in play domestically since the second WBBL season.
The number of fielders allowed outside the inner circle during non-powerplay overs was reduced from five to four.
Combined with increased professionalism and athleticism, a greater emphasis on boundary-hitting, as well as (generally) better playing surfaces, the new playing conditions appear to have created a perfect storm for the surge in the T20I run rate over the last 12-18 months.
The teams that have set the pace are, not coincidentally, the only six nations to have a T20I centurion and the six whose players make up the majority of participants in the WBBL and KSL (Australia, England, India, New Zealand, South Africa and West Indies).
| Team | Strike rate | Balls per 4 | Balls per 6 | Balls per boundary |
| Australia | 124.44 | 6.3 | 56.4 | 5.7 |
| England | 123.73 | 6.9 | 61.0 | 6.2 |
| India | 118.60 | 7.7 | 37.3 | 6.4 |
| New Zealand | 118.12 | 7.6 | 43.6 | 6.5 |
| South Africa | 107.11 | 9.4 | 37.7 | 7.8 |
| West Indies | 104.46 | 10.2 | 41.8 | 8.2 |
| Ireland | 87.36 | 10.2 | 215.2 | 9.8 |
| Sri Lanka | 86.28 | 12.9 | 135.2 | 11.7 |
| Pakistan | 84.54 | 13.5 | 230.2 | 12.8 |
| Bangladesh | 78.54 | 14.4 | 117.9 | 12.8 |
Just one Sri Lankan and two Irish women have played in the WBBL or KSL, with women from Pakistan and Bangladesh yet to feature in either. The average strike rate in women’s T20Is played between the top 10 nations since the 2017 World Cup has been 105.57.
Of the 35 women to have scored 100-plus runs at over the average SR during that period, 27 have played in one or both of the WBBL and KSL.
The only players to have made centuries in either the WBBL or KSL so far, had already played international cricket before doing so.
Bridging the gap to T20Is was a key factor in the foundation of both leagues. A clear disparity exists between the achievements of capped and uncapped batters in both leagues, but the WBBL offers greater opportunities for uncapped players, due to a greater number of teams and fixtures.
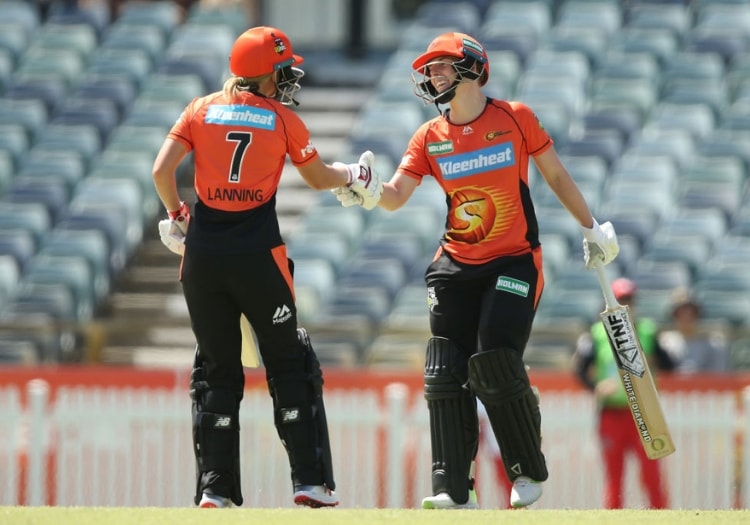
The WBBL has played a major role in upping the scoring rate in women's cricket
Uncapped players batted more innings (415) and faced more balls (4162) in the first season of the WBBL, than uncapped English players have in all three KSL seasons combined (2977 balls in 313 innings). In all, uncapped Australian players have faced 30 per cent of balls in the WBBL, compared with 21 per cent of KSL balls faced for uncapped English players.
Internationally capped players have scored faster in each KSL season compared with the last, and scored at a virtually identical rate in the 2018 season (122.06) as internationals in the current WBBL 2018-19 season (122.24).
Uncapped Australian players in WBBL04 are currently scoring faster (108.03, as at December 31, 2018) than internationally capped players did during WBBL03 (107.52).
SIGN UP FOR OUR NEWSLETTER
Uncapped English players however haven't displayed the same improvement as their Australian counterparts in the WBBL. On average uncapped English players scored no faster in the 2018 KSL (92.24) than they did in the inaugural season in 2016 (94.76).
Twenty-two WBBL half-centuries have been made by 12 uncapped Australians, compared with three half-centuries from three uncapped English players in the KSL.
It took until the third KSL season for an uncapped English player (Sophia Dunkley was the first) to bring up a half-century.
Dunkley, who looked at home as she top-scored in her first T20I innings for England, suggests KSL success could be a barometer of international success. The issue for uncapped English players has been getting an opportunity to achieve that KSL success in the first place.
Subscribe to The Cricketer for exclusive content every day: The inside track on England's Test tour with George Dobell in Pakistan, award-winning analysis, breaking news and interviews and the only place for in-depth county coverage all year round. Plus: An ad-free app experience at your fingertips. Subscribe to thecricketer.com today for just £1.

Welcome to www.thecricketer.com - the online home of the world’s oldest cricket magazine. Breaking news, interviews, opinion and cricket goodness from every corner of our beautiful sport, from village green to national arena.