
Cricket analyst DAN WESTON has written a new book, Strategies for Success in the Indian Premier League. In this extract, he discusses the importance of boundary-hitting in T20 cricket

Across numerous sports, a particular area of data has caused such an impact that it has revolutionised the way that teams approached that sport. For example, Michael Lewis wrote in Moneyball about how Oakland Athletics realised through analytics that in baseball, several metrics such as on-base percentage and slugging percentage (combined to create a metric called OPS - on-base plus slugging) were undervalued in the player marketplace, compared to other metrics which tradition, and conventional wisdom, considered more important.
Perhaps the equivalent in football would be Expected Goals (xG), which has become more mainstream in recent years. Data in this area could demonstrate to teams that certain decisions, such as long shots and crosses, were potentially overvalued and therefore should be chosen as options less frequently by players.
Another example of analytics influencing the way teams strategise is in basketball, with teams realising that taking three-point shots was more efficient than mid-range two pointers - basketball’s ‘three-point moment’. In an article for abc7news.com, Gregg Popovich, the head coach of the San Antonio Spurs, is quoted as saying that “Now you look at a stat sheet after a game and the first thing you look at is the 3s. If you made 3s and the other team didn't, you win.”
In cricket journalist Jarrod Kimber’s piece at thecricketmonthly.com in 2019, Kimber stated that in cricket ‘we haven't had one big moment like three-point shooting in basketball.’ While Kimber is probably correct in his assertion - at least in the public domain - my view is that this isn’t necessarily because people don’t have the data or skills to create that moment in cricket, but a large chunk of the reason is due to the difficulties in bringing that data and skills to market.
Even if a random person could completely ‘solve’ T20 cricket, it is far from a given that this person would ever be able bring it to market by finding a team who were willing to implement their strategies.
It wouldn’t be a surprise to me at all if boundary percentages or boundary runs in a team’s innings turned out to be cricket’s three point moment. When I look at a scorecard of a match, fours and sixes scored is the first thing I look for (looking at which bowlers were selected being a close second). Furthermore, discussing drivers of T20 success with the teams that I have worked with, they are frequently shocked when I tell them the percentage that the team with the highest boundary percentage wins the match in their given league.
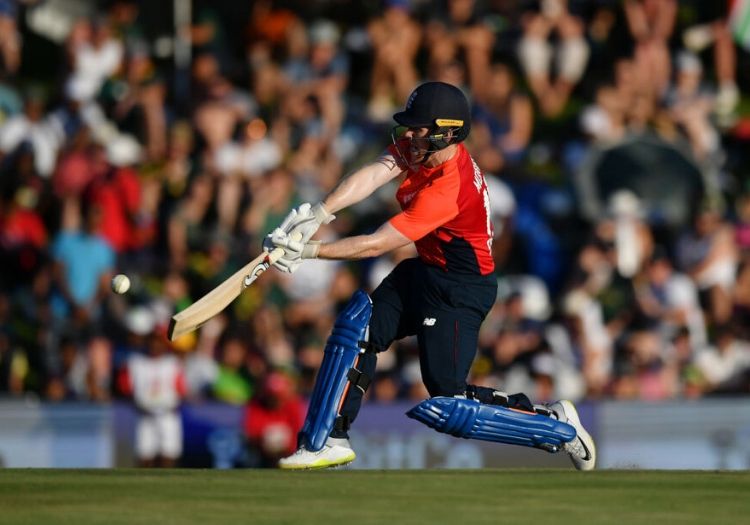
Eoin Morgan is a fine boundary-hitter in T20 cricket
At one of the T20 Blast teams which I have performed consultancy work for, I even asked their captain to guess what percentage this was in the North Group (the group which his team competed in), and his guess was 70%. In fact, in the North Group of the T20 Blast, 86% of teams with the highest percentage of boundaries won non-tied matches across the 2018 and 2019 seasons.
This percentage is remarkably similar to that of the Indian Premier League, which came out at just shy of 87% across the 2017-2019 seasons - so we can see that the team with the highest boundary percentage in their innings wins almost nine out of ten matches across various competitions, and in almost all of the cases the teams losing but with the highest winning percentage either lost an extremely close match or were victim of a relatively above-average six-hitting display by their opposition (so the opposition scored fewer boundaries, but the boundaries they hit were often worth two runs more).
Of course, winning the boundary percentage count is a two-way street. As battingorientated T20 teams have found out throughout the years, having an attacking batting line-up is no guarantee of success - they must also have a bowling attack good enough to restrict the boundaries of the opposition. Essentially, winning the boundary percentage count focuses as much on boundary-scoring from a team’s batsmen, as it does boundary prevention via that that team’s bowlers.
Moving on, we can compare win percentage for boundary percentage winners to similar analysis on the dot-ball percentage. During the same time period, the team with the lowest dot ball percentage won just under 65% of the time, showing that it is useful for a team to have the lowest dot ball percentage in the match in which they are playing in, but it’s certainly not as desirable as having the highest boundary percentage.
Indeed, for the dot ball percentage to really drive team success, it would need to be under 25% of balls faced (30 out of the maximum 120). If we look at five percentage unit brackets for dot ball percentages higher than this (e.g. 25.00-29.99, 30.00-34.99 and so on) in the Indian Premier League during this time period, every other bracket apart from below 25% of balls faced had a win percentage below 55%.
Having established that team boundary percentage is an overwhelming driver of team success, what sort of boundary numbers are required for success in the Indian Premier League? To start with, no team lost in the last three years when scoring in excess of 27% boundaries, which isn’t entirely a surprise - we’ve already seen earlier in this book how few batsmen can sustain this rate of boundary hitting over a three-year period. Teams scoring at least 24% boundaries won 90% of the time, while teams scoring 21% or greater won 74% of the time.
Conversely, teams scoring fewer than 12% of boundaries had a dreadful success rate, winning just 18% of the time. Given that we’ve already discovered earlier in this book that batting strike rate is hugely driven by boundary percentage, again, all this shouldn’t be a huge surprise - teams are going to struggle hugely to win many matches while scoring considerably below the mean boundary rate for the competition.
The chart below shows the innings runs versus innings boundary percentages for Indian Premier League teams batting first and being allowed to use their full 120 balls (their innings was not weather affected) across the last three seasons. Here we can see a general slope from bottom-left to top-right, indicating that innings runs generally increases as innings boundary percentage increases.
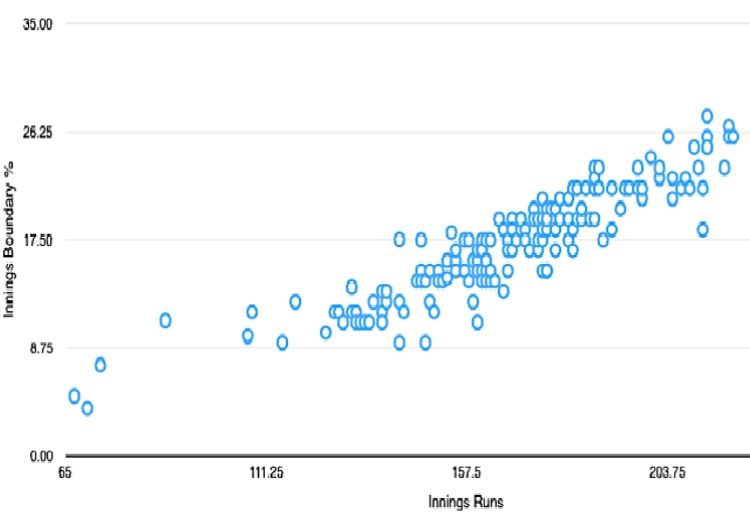
Looking at the chart, we can also see that if a team scores in excess of 20% of boundaries, then they will almost certainly score 170+, and the overwhelming majority of team scores of 150 or below feature boundary percentages of 15% or below. Very few teams with below-average boundary percentages scored 170, and no team scored in excess of 170 with below 15% boundaries in their innings.
No team broke 180 with below 16.67% boundaries (an average of one boundary every six balls). Only two of the 38 teams scoring 190+ scored fewer than 20% boundaries in their innings, and the lowest boundary percentage for a 200+ total was 18.33% (and an incredibly low 20.83% dot ball percentage) giving even more evidence - if you somehow needed it - that boundary percentages are an absurdly huge driver of high scoring rates.
To go about purchasing the book, click here
Subscribe to The Cricketer for exclusive content every day: The inside track on England's Test tour with George Dobell in Pakistan, award-winning analysis, breaking news and interviews and the only place for in-depth county coverage all year round. Plus: An ad-free app experience at your fingertips. Subscribe to thecricketer.com today for just £1.

Welcome to www.thecricketer.com - the online home of the world’s oldest cricket magazine. Breaking news, interviews, opinion and cricket goodness from every corner of our beautiful sport, from village green to national arena.